Matplotlib Publication Figure Template
A Python script with pre-configured rcParams and helper functions that produce clean, publication-ready figures matching journal style guides — without wrestling with matplotlib defaults.
You're in — download starting…
Your email joined the newsletter list. One workflow per week, unsubscribe anytime.
Download didn't start? Click here →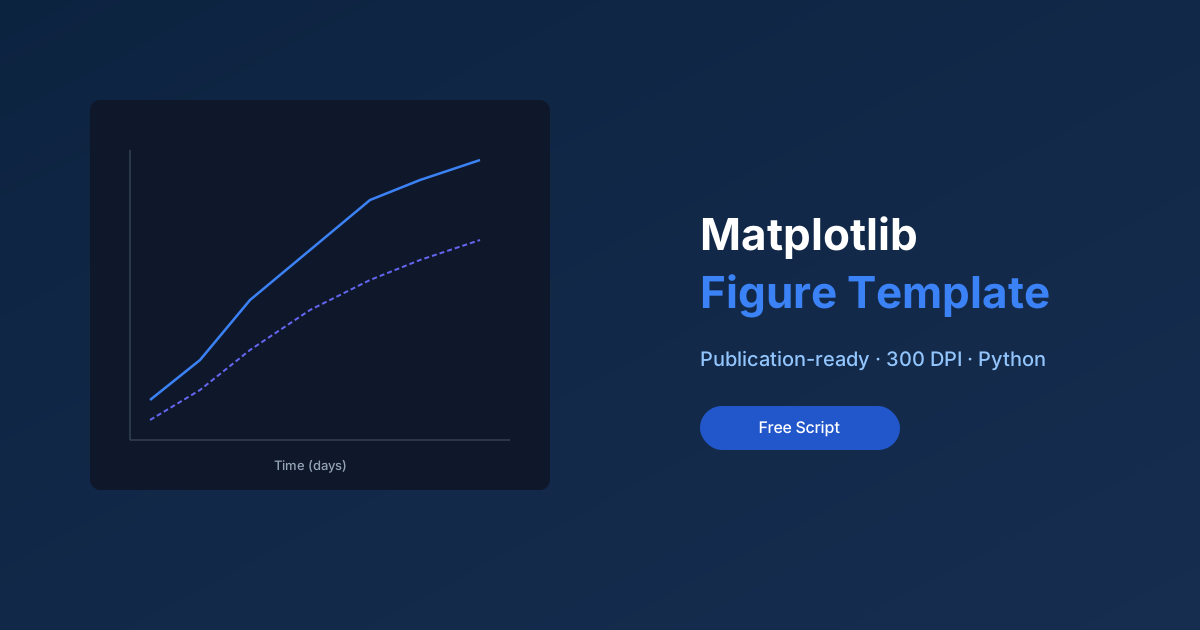
What's Included
- rcParams preset for journal-quality output (300 DPI, correct font sizes)
- Single-column and double-column figure size helpers
- Clean colour palettes (colour-blind friendly)
- Helper functions: annotate_significance(), add_panel_labels(), save_fig()
- Line plot, bar chart, scatter plot, and boxplot examples
- LaTeX-compatible font rendering settings
- requirements.txt with matplotlib, numpy, scipy
Who This Is For
- Researchers submitting to journals with strict figure formatting requirements
- PhD students producing thesis figures that look professional
- Anyone tired of reformatting matplotlib output before submission
What Makes a Publication-Quality Figure
Journal requirements typically demand:
- 300 DPI minimum (often 600 for line art)
- Figure width: 86 mm (single column) or 176 mm (double column) — exact values depend on journal
- Font size: 8–10pt for axis labels, consistent with body text
- No chart junk: white background, no box spines, minimal grid lines
- Colour-blind friendly palettes (avoid red/green alone)
This template sets all of these automatically. A single import figure_styles at the top of a notebook applies the preset.
Example Usage
import matplotlib.pyplot as plt
import numpy as np
from figure_styles import apply_journal_style, save_fig, single_col_width

apply_journal_style()

fig, ax = plt.subplots(figsize=(single_col_width, single_col_width * 0.75))
ax.plot(x, y, color='#2563eb', lw=1.5, label='Treatment')
ax.set_xlabel('Time (days)')
ax.set_ylabel('Response (AU)')
ax.legend(frameon=False)

save_fig(fig, 'my_figure', formats=['pdf', 'svg'])
Output: my_figure.pdf and my_figure.svg at the correct DPI, ready for submission.
Overview
A matplotlib style file plus example scripts that produce journal-compliant figures by default: correct single-column sizing (89 mm), colorblind-safe Okabe-Ito series, embedded-font vector export, and the quiet grid-and-spine styling reviewers never comment on — which is the point.
Why use it
Figure styling code copied between scripts drifts, and drift is how a paper ends up with three different font sizes across its figures. A style file makes the correct look the default: plt.style.use(...) at the top of every script, zero styling code below it, identical output forever.
How to use it
- Download and place the
.mplstylefile in your project (or matplotlib’s config dir). - Add
plt.style.use("augmented-scholar.mplstyle")before any plotting call. - Use the included example scripts as starting points — line, bar, and multi-panel layouts sized for single and double columns.
- Export with the included save helper: vector PDF for submission, 300-dpi PNG for slides.
Ready to get started?
Enter your email and I'll send the link straight to your inbox.
Every subscriber gets the full resource library in the welcome email. Free, no spam, unsubscribe anytime.
Check your inbox!
The download link is on its way. Can't find it? Check spam.
Download didn't start? Click here →