Plotly — Interactive Charts for Python and R
Plotly makes charts readers can hover, zoom, and rotate, and Dash turns an analysis into a web app. Weaker than …

Plotly makes charts readers can hover, zoom, and rotate, and Dash turns an analysis into a web app. Weaker than …

uv replaces pip, venv, and pyenv with one fast binary and a lockfile by default. The best way to start a Python project …

Conda installs the binary dependencies pip cannot — CUDA, GDAL, compilers, R. Heavier and slower than uv, and still the …

PyCharm offers the deepest Python debugging and refactoring available, free on an academic licence. Heavy, complex, and …

Colab runs Jupyter notebooks on Google's machines with free GPU access and zero setup. Unbeatable for teaching — …

Stop hand-coding LaTeX tables. Learn how to use Pandas' to_latex() method to convert CSV data into publication-ready …

Stop manually updating your publication list. Learn how to build a Python + LaTeX pipeline that automatically fetches …
A complete guide to using Git and GitHub for research code, data scripts, and even your thesis — explained for …
Jupyter interleaves code, output, and narrative in one document — the standard for exploratory analysis. Its hidden …
Matplotlib gives you exact control over every element of a figure, which is what journal specifications demand. Verbose, …
VS Code replaces a separate LaTeX editor, Python IDE, and Markdown app with one tool. Free and extensible — at the cost …
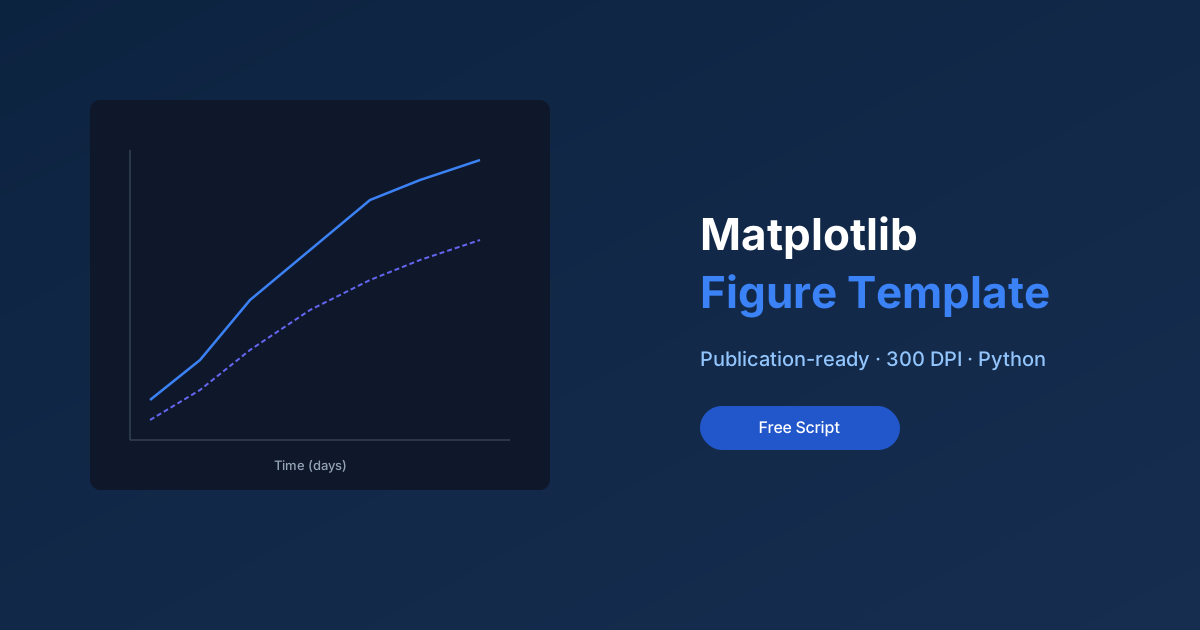
A Python script with pre-configured rcParams and helper functions that produce clean, publication-ready figures matching …